上一篇
D3.js v4力导向图如何轻松实现数据动态交互
- 行业动态
- 2025-04-25
- 2
D3.js v4的force模块通过力学模拟实现动态网络图布局,支持自定义节点、边及力学参数(电荷力、碰撞检测等),适用于复杂关系数据可视化,如社交网络、知识图谱等场景,提供交互式拖拽与自动布局调整功能,可结合缩放、动画优化可视化效果。
在数据可视化领域,D3.js 的力导向图(Force-Directed Graph)因其动态交互能力和优雅的布局效果,成为展示复杂网络关系的首选工具,D3.js v4 版本对力导向模块进行了模块化重构,通过 d3-force 实现更精细的物理模拟控制,以下内容将从实现原理、核心配置到实践案例,全面解析这一技术。
力导向图的核心机制
力导向图通过模拟物理世界中的粒子相互作用,自动计算节点位置,D3.js v4 的 d3-force 模块包含以下核心作用力:
电荷力 (
forceManyBody)
控制节点间的吸引或排斥,通过strength参数调整强度(正值为排斥,负值为吸引)。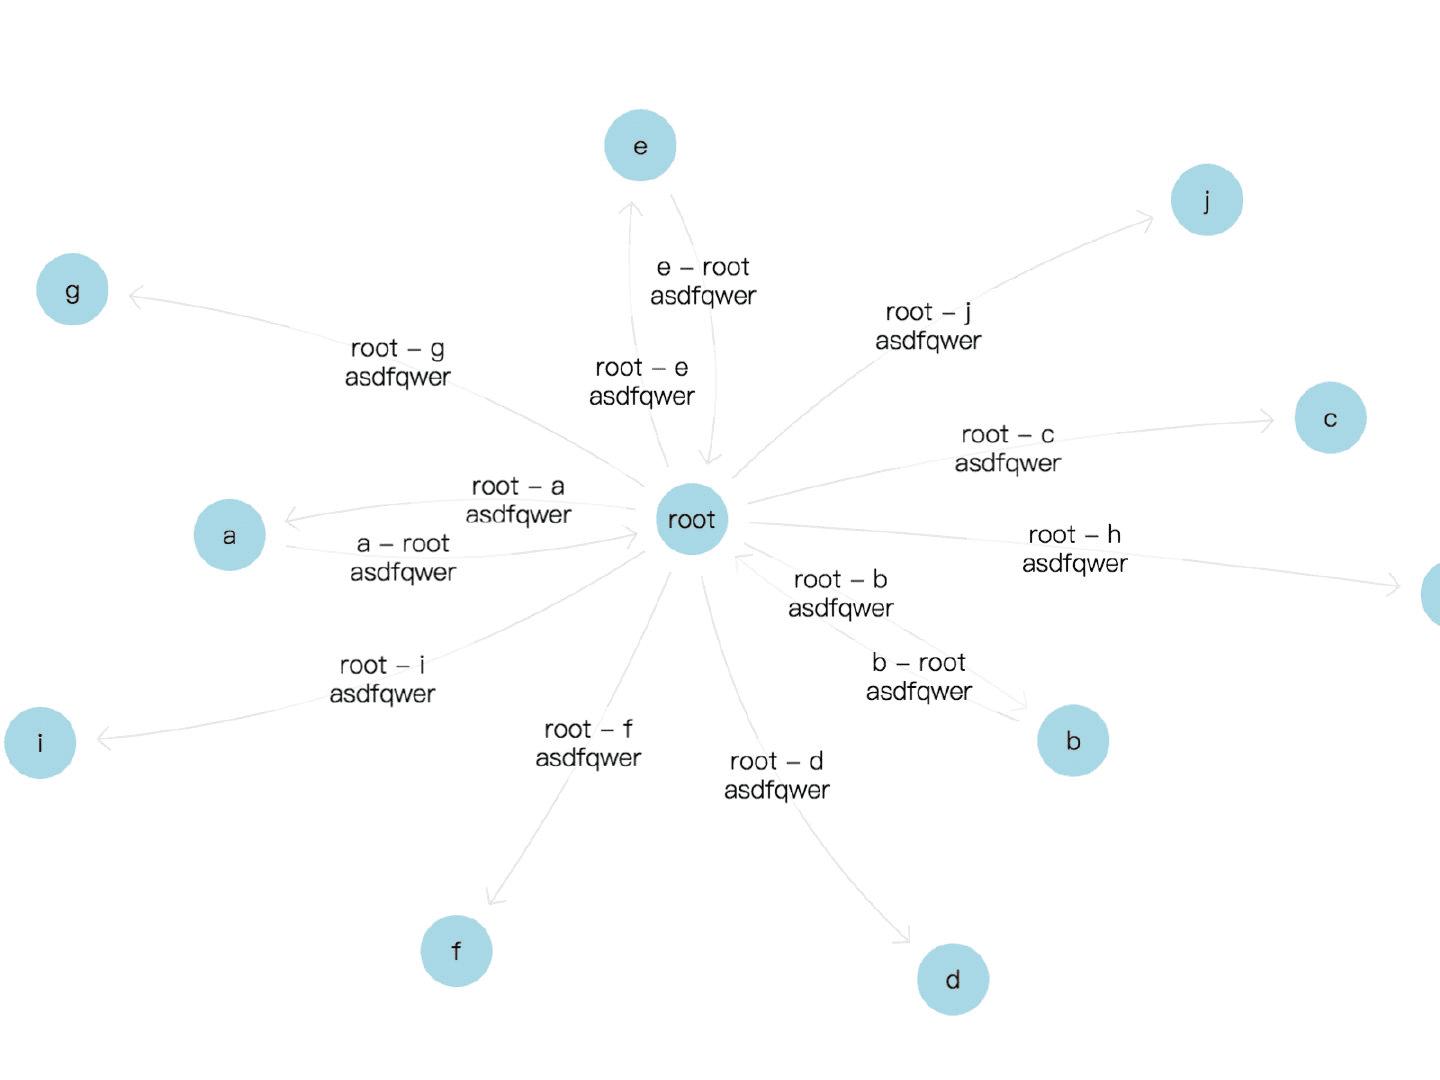
simulation.force("charge", d3.forceManyBody().strength(-50));碰撞力 (
forceCollide)
防止节点重叠,radius定义节点的碰撞检测半径。simulation.force("collide", d3.forceCollide().radius(30));连接力 (
forceLink)
根据边的source和target属性计算连线的最优距离。simulation.force("link", d3.forceLink().id(d => d.id).distance(100));定位力 (
forceX/forceY)
将节点拉向画布中心或其他坐标点,通过strength控制拉力强度。
实现步骤详解
初始化画布与数据
const svg = d3.select("body").append("svg")
  .attr("width", 800)
  .attr("height", 600);
const graph = {
  nodes: [{id: "A"}, {id: "B"}, {id: "C"}],
  links: [{source: "A", target: "B"}, {source: "B", target: "C"}]
};
创建力模拟器
const simulation = d3.forceSimulation()
  .nodes(graph.nodes)
  .force("link", d3.forceLink(graph.links))
  .force("charge", d3.forceManyBody().strength(-120))
  .force("center", d3.forceCenter(400, 300));
绘制图形元素
节点绘制
动态更新位置需通过tick事件驱动:const nodes = svg.selectAll("circle") .data(graph.nodes) .enter().append("circle") .attr("r", 10); simulation.on("tick", () => { nodes.attr("cx", d => d.x) .attr("cy", d => d.y); });边线绘制
边的坐标随节点实时更新:const links = svg.selectAll("line") .data(graph.links) .enter().append("line"); simulation.on("tick", () => { links.attr("x1", d => d.source.x) .attr("y1", d => d.source.y) .attr("x2", d => d.target.x) .attr("y2", d => d.target.y); });
高级交互优化
拖拽行为
通过 d3.drag 实现节点拖拽:
nodes.call(d3.drag()
  .on("start", (event, d) => {
    if (!event.active) simulation.alphaTarget(0.3).restart();
    d.fx = d.x;
    d.fy = d.y;
  })
  .on("drag", (event, d) => {
    d.fx = event.x;
    d.fy = event.y;
  })
  .on("end", (event, d) => {
    if (!event.active) simulation.alphaTarget(0);
    d.fx = null;
    d.fy = null;
  }));
缩放控制
添加画布缩放事件:
const zoom = d3.zoom()
  .scaleExtent([0.5, 4])
  .on("zoom", (event) => {
    svg.attr("transform", event.transform);
  });
svg.call(zoom);
性能优化建议
- 减少计算负载
对超过 500 个节点的大型数据集,可关闭部分作用力(如碰撞检测)或降低迭代次数(simulation.alphaDecay())。 - 使用 Web Workers
将力的计算过程移至后台线程,避免页面卡顿。 - GPU 加速
通过 CSStransform属性替代直接修改坐标属性,提升渲染性能。
应用场景实例
- 社交网络分析:可视化用户关系密度与社区结构。
- 知识图谱:动态展示实体间的语义关联。
- 系统架构拓扑:实时监控服务器节点状态。
参考文献
- D3.js 官方文档, d3-force模块
- Observable 示例, Force-Directed Graph
- 数据可视化权威指南, Mike Bostock 著


