上一篇
html画报表
- 行业动态
- 2025-04-29
- 3788
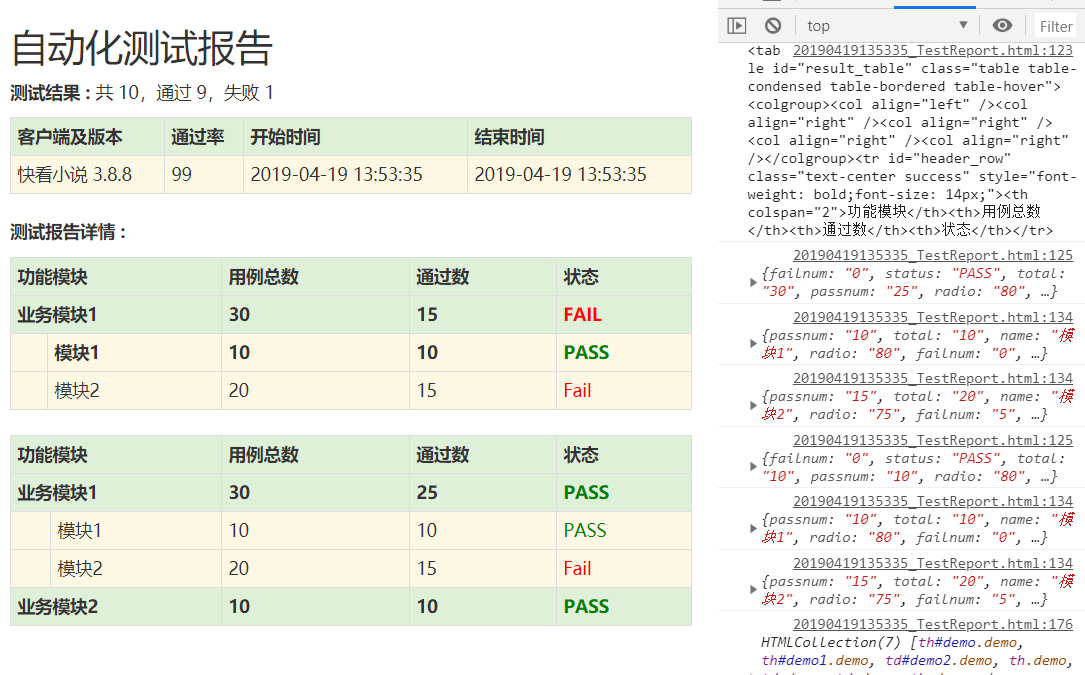
使用HTML表格结构结合CSS样式美化,配合JavaScript动态渲染数据,可嵌入图表库(如ECharts)实现可视化报表,支持响应式
使用%ignore_a_3%制作报表的详细说明
HTML报表的基本结构
文档类型声明

- 必须以
<!DOCTYPE html>开头,声明HTML5文档类型 - 示例:
<!DOCTYPE html>
- 必须以
基础框架搭建
<html>
  <head>
    <meta charset="UTF-8">
    <title>报表标题</title>
    <style>
      / 内联样式区域 /
    </style>
  </head>
  <body>
    <!-报表内容区域 -->
  </body>
</html>
表格元素的应用
基本表格结构
| 元素 | 作用 | 示例 |
|---|---|---|
<table> | 定义表格 | <table border="1"> |
<thead> | 表头区域 | <thead><tr><th>列名</th></tr></thead> |
<tbody> | <tbody><tr><td>数据</td></tr></tbody> | |
<tr> | 表格行 | <tr>...</tr> |
<th> | 表头单元格 | <th>月份</th> |
<td> | 数据单元格 | <td>¥10,000</td> |
合并单元格
<table border="1">
  <tr>
    <th rowspan="2">部门</th>
    <th colspan="3">季度</th>
  </tr>
  <tr>
    <th>Q1</th>
    <th>Q2</th>
    <th>Q3</th>
  </tr>
</table>
样式美化技巧
CSS样式应用
table {
  width: 80%;
  margin: 20px auto;
  border-collapse: collapse;
}
th {
  background-color: #4CAF50;
  color: white;
  text-align: center;
}
td {
  text-align: right;
  padding: 8px;
}
.total {
  font-weight: bold;
  background-color: #f2f2f2;
}
斑马纹效果
tbody tr:nth-child(odd) {
  background-color: #f9f9f9;
}
tbody tr:nth-child(even) {
  background-color: #ffffff;
}
动态数据展示
JavaScript数据填充
const data = [
  ['产品A', 120, 150, 90],
  ['产品B', 80, 110, 130]
];
const tableBody = document.querySelector('tbody');
data.forEach(row => {
  const tr = document.createElement('tr');
  row.forEach(cell => {
    const td = document.createElement('td');
    td.textContent = cell;
    tr.appendChild(td);
  });
  tableBody.appendChild(tr);
});
数据可视化集成
<script src="https://cdn.jsdelivr.net/npm/chart.js"></script>
<canvas id="myChart"></canvas>
<script>
  const ctx = document.getElementById('myChart').getContext('2d');
  new Chart(ctx, {
    type: 'bar',
    data: {
      labels: ['Q1', 'Q2', 'Q3'],
      datasets: [{
        label: '销售额',
        data: [120, 150, 90],
        backgroundColor: 'rgba(76, 175, 80, 0.6)'
      }]
    }
  });
</script>
高级功能实现
响应式设计
@media screen and (max-width: 600px) {
  table {
    width: 100%;
    font-size: 12px;
  }
  th, td {
    padding: 4px;
  }
}
导出功能
<button onclick="exportTable()">导出Excel</button>
<script>
function exportTable() {
  const table = document.querySelector('table');
  const excelContent = table.outerHTML.replace(/</?thead>/g, '');
  const a = document.createElement('a');
  a.href = 'data:application/vnd.ms-excel,' + encodeURIComponent(excelContent);
  a.download = 'report.xls';
  a.click();
}
</script>
常见问题与解答
Q1:如何优化大数据量报表的加载速度?
A1:可以采用以下方法:
- 使用
<thead>和<tbody>分离结构 - 按需加载数据(分页或懒加载)
- 压缩CSS和JavaScript文件
- 使用CDN加速资源加载
- 对表格数据进行服务器端预处理
Q2:如何实现报表的打印友好布局?
A2:建议采取以下措施:
- 添加@media print媒体查询
- 隐藏非打印元素(导航栏、广告等)
- 设置打印专用样式:
@media print { table { width: auto; border: 1px solid #000; } th, td { border: 1px solid #000; } } - 调整字体大小和颜色对比度


