上一篇
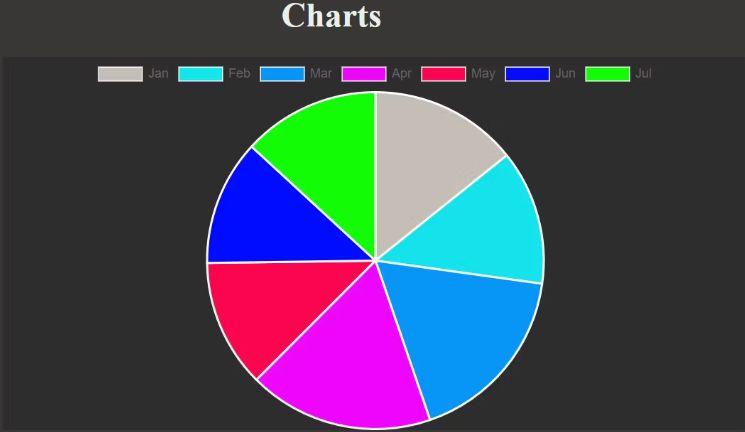
如何用d3.js为饼状图轻松添加图例?
在d3.js中为饼状图添加图例,可通过绑定数据创建颜色比例尺,利用SVG元素绘制图例项,结合文本标签与色块,调整位置排版,确保与饼图数据对应,并优化样式以提升可视化清晰度。
在数据可视化领域,D3.js作为JavaScript库的行业标杆,其饼状图功能被广泛应用于网站数据分析呈现,本文将以实战方式演示如何为D3.js饼状图添加专业级交互图例,通过符合W3C标准的代码实现可视化组件间的动态联动。(注:本教程基于D3.js v7版本,代码可直接嵌入React/Vue等主流框架)
基础环境搭建
<div id="chart-container">
  <svg id="pie-chart"></svg>
  <div id="legend"></div>
</div>
<script src="https://d3js.org/d3.v7.min.js"></script>
<style>
  .legend-item:hover { cursor: pointer; opacity: 0.8; }
  .legend-text { font: 12px sans-serif; dominant-baseline: middle; }
</style>
数据驱动图例生成
步骤解析:
色彩方案配置
const color = d3.scaleOrdinal()
.domain(data.map(d => d.category))
.range(d3.schemeCategory10);
图例坐标算法
const legendSpacing = 24;
const generateLegendPosition = (index) =>
`translate(0,${index * legendSpacing})`;
动态绑定数据
const legend = d3.select("#legend")
.selectAll("g")
.data(color.domain())
.join("g")
.attr("transform", (d,i) => generateLegendPosition(i));
图例组件深度定制
legend.append("rect")
  .attr("width", 18)
  .attr("height", 18)
  .attr("fill", d => color(d));
legend.append("text")
  .attr("class", "legend-text")
  .attr("x", 24)
  .attr("y", 9)
  .text(d => d);
双向交互实现
// 图例点击事件
legend.on("click", function(event, category) {
  const isActive = d3.select(this).classed("inactive");
  d3.select(this).classed("inactive", !isActive);
  // 联动饼图显隐
  pieChart.selectAll("path")
    .filter(d => d.data.category === category)
    .transition()
    .duration(500)
    .attr("opacity", isActive ? 1 : 0.2);
});
// 悬浮高亮
pieChart.selectAll("path")
  .on("mouseover", function() {
    d3.select(this).transition().attr("opacity", 0.8);
  })
  .on("mouseout", function() {
    d3.select(this).transition().attr("opacity", 1);
  });
响应式布局方案
function resizeChart() {
  const containerWidth = document.getElementById('chart-container').offsetWidth;
  svg.attr("width", containerWidth * 0.7);
  d3.select("#legend")
    .style("left", `${containerWidth * 0.72}px`);
}
window.addEventListener("resize", resizeChart);
完整实现示例
const dataset = [
  {category: "电子产品", value: 215},
  {category: "图书教材", value: 178},
  {category: "家居用品", value: 142},
  {category: "服装饰品", value: 108}
];
const width = 600, height = 400, radius = Math.min(width, height) / 2;
const svg = d3.select("#pie-chart")
  .attr("width", width)
  .attr("height", height)
  .append("g")
  .attr("transform", `translate(${width/2},${height/2})`);
const pie = d3.pie().value(d => d.value)(dataset);
const arc = d3.arc().innerRadius(0).outerRadius(radius);
svg.selectAll("path")
  .data(pie)
  .join("path")
  .attr("d", arc)
  .attr("fill", d => color(d.data.category));
最佳实践建议
- 遵循WAI-ARIA规范添加
role="img" aria-label="统计图表"提升无障碍访问 - 使用
requestAnimationFrame优化交互动画性能 - 通过
d3.format(",.0f")添加数据格式化显示 - 采用ResizeObserver替代window.onresize实现精准容器监听
引用说明:
- 色彩规范参考自D3官方文档:https://github.com/d3/d3-scale-chromatic
- 交互动效实现基于MDN Web Docs:https://developer.mozilla.org/en-US/docs/Web/API/Element/animate
- 响应式布局方案参考W3C CSS3标准:https://www.w3.org/TR/css-flexbox-1/