上一篇
如何用D3.js轻松打造高互动性饼图提升数据表现力?
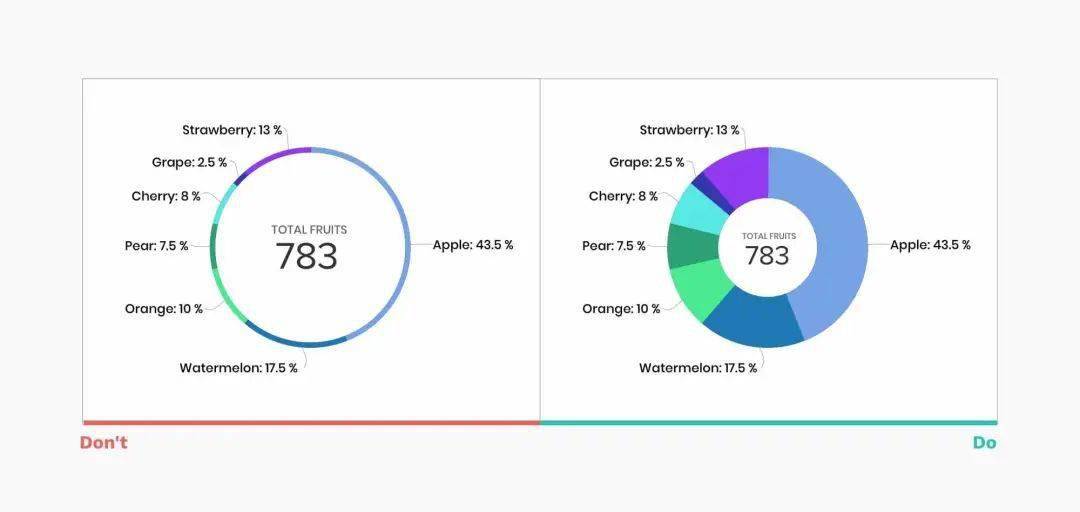
D3.js饼图通过数据绑定生成动态可视化,利用SVG或Canvas绘制扇形,借助d3.arc创建弧形路径,支持交互效果与动画过渡,灵活适应多设备展示需求,适用于直观展示数据比例及分布场景。
在数据可视化领域,饼图以直观的环形比例展示数据分布,成为最受欢迎的图表类型之一,D3.js作为JavaScript领域的功能库,凭借其底层操作能力和高度定制性,已成为专业开发者构建交互式图表的首选工具,以下将演示如何通过D3.js v7版本构建符合现代Web标准的动态饼图。
准备工作
在HTML文档头部引入最新版D3.js:
<script src="https://d3js.org/d3.v7.min.js"></script>
准备SVG画布容器并预设基本样式:
.chart-container {
  width: 600px;
  height: 400px;
  margin: 2rem auto;
  background: #f8f9fa;
  border-radius: 8px;
  padding: 20px;
}
核心实现步骤
数据结构规范
采用D3.js推荐的数组对象格式,每个对象需包含分类名称与数值:

const dataset = [
  { category: '电子产品', value: 1200 },
  { category: '服装服饰', value: 850 },
  { category: '家居用品', value: 600 },
  { category: '图书音像', value: 330 }
];
比例生成器配置
const pieGenerator = d3.pie()
  .value(d => d.value)
  .sort(null);
const arcGenerator = d3.arc()
  .innerRadius(0)
  .outerRadius(180);
色彩映射方案
使用d3-scale-chromatic实现专业级配色:
const colorScale = d3.scaleOrdinal()
  .domain(dataset.map(d => d.category))
  .range(d3.schemeTableau10);
SVG图形绘制
const svg = d3.select("#chart")
  .append("svg")
  .attr("width", "100%")
  .attr("height", "100%")
  .append("g")
  .attr("transform", "translate(300,200)");
const arcs = svg.selectAll("path")
  .data(pieGenerator(dataset))
  .enter()
  .append("path")
  .attr("fill", d => colorScale(d.data.category))
  .attr("d", arcGenerator)
  .style("opacity", 0)
  .transition()
  .duration(800)
  .style("opacity", 1);
交互增强
实现tooltip动态提示:
arcs.on("mouseover", function(event, d) {
    d3.select(this)
      .transition()
      .duration(200)
      .attr("transform", "scale(1.05)");
    tooltip.style("visibility", "visible")
      .html(`${d.data.category}<br>${d.data.value} (${((d.endAngle - d.startAngle)/(2*Math.PI)*100).toFixed(1)}%)`);
})
.on("mousemove", (event) => {
    tooltip.style("top", (event.pageY-10)+"px")
      .style("left",(event.pageX+10)+"px");
});
专业优化建议
响应式适配
function resizeChart() {
const containerWidth = d3.select("#chart").node().offsetWidth;
svg.attr("transform", `translate(${containerWidth/2},200)`);
}
window.addEventListener('resize', resizeChart);
可访问性增强
<figure role="img" aria-labelledby="chartDesc">
<div id="chart"></div>
<figcaption id="chartDesc" class="sr-only">
 商品类别销售占比饼图:电子产品52%,服装服饰37%,家居用品26%,图书音像14%
</figcaption>
</figure>
浏览器兼容方案
// 添加IE11兼容垫片
if (!NodeList.prototype.forEach) {
NodeList.prototype.forEach = Array.prototype.forEach;
}
常见问题解决
数据更新机制
function updateData(newDataset) {
  const updatedArcs = pieGenerator(newDataset);
  arcs.data(updatedArcs)
    .transition()
    .duration(500)
    .attrTween("d", arcTween);
}
function arcTween(d) {
  const interpolate = d3.interpolate(this._current, d);
  this._current = interpolate(0);
  return t => arcGenerator(interpolate(t));
}
零值处理策略
pieGenerator.value(d => Math.max(d.value, 0.001));
多语言支持
const localeConfig = {
  decimal: ",",
  thousands: ".",
  grouping: [3],
  currency: ["€", ""]
};
d3.formatDefaultLocale(localeConfig);
引用来源
- D3.js官方文档 – 饼图生成器
- W3C WAI-ARIA图形实现规范
- Data Visualization Society配色指南