上一篇
如何用D3.js快速绘制四个象限图表?
- 行业动态
- 2025-04-21
- 5
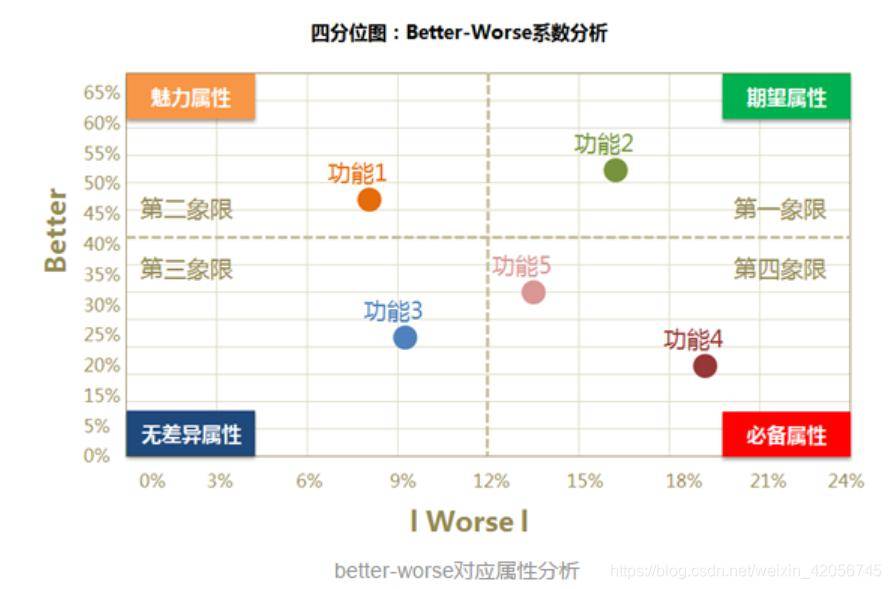
使用D3.js绘制四象限图需先定义坐标轴比例尺,确定原点位置,通过SVG绘制横纵轴线划分区域,添加刻度标签,并利用数据绑定动态定位元素,通过路径或矩形填充背景颜色可区分象限,最后调整样式优化可视化效果。
基础环境搭建
<!DOCTYPE html>
<html>
<head>
  <script src="https://d3js.org/d3.v7.min.js"></script>
  <style>
    .axis path { stroke: #555; }
    .quadrant { opacity: 0.15; }
    .label { font: 14px Arial; user-select: none; }
  </style>
</head>
<body>
  <div id="chart"></div>
</body>
</html>
核心实现步骤
- 初始化画布
const width = 600,
   height = 400,
   margin = 50;
const svg = d3.select(“#chart”)
.append(“svg”)
.attr(“width”, width)
.attr(“height”, height)
.style(“background”, “#f9f9f9”);
2. **创建坐标系**
```javascript
const xScale = d3.scaleLinear()
  .domain([-10, 10])
  .range([margin, width - margin]);
const yScale = d3.scaleLinear()
  .domain([-8, 8])
  .range([height - margin, margin]);
// 绘制X轴(垂直居中)
svg.append("g")
  .attr("transform", `translate(0, ${height/2})`)
  .call(d3.axisBottom(xScale).tickSize(-height + 2*margin));
// 绘制Y轴(水平居中)
svg.append("g")
  .attr("transform", `translate(${width/2}, 0)`)
.call(d3.axisRight(yScale).tickSize(-width + 2*margin));- 绘制四象限颜色区块
const quadrantData = [
{x: [margin, width/2], y: [margin, height/2], color: "#ffd700"}, // 第一象限
{x: [width/2, width-margin], y: [margin, height/2], color: "#90ee90"}, // 第二象限
{x: [margin, width/2], y: [height/2, height-margin], color: "#87ceeb"}, // 第三象限
{x: [width/2, width-margin], y: [height/2, height-margin], color: "#ffb6c1"} // 第四象限
];
quadrantData.forEach(d => {
svg.append(“rect”)
.attr(“x”, d.x[0])
.attr(“y”, d.y[0])
.attr(“width”, d.x[1] – d.x[0])
.attr(“height”, d.y[1] – d.y[0])
.attr(“fill”, d.color)
.classed(“quadrant”, true);
});
4. **添加象限标签**
```javascript
const labels = [
  {text: "高价值区", x: width/4, y: height/4},
  {text: "潜力增长区", x: 3*width/4, y: height/4},
  {text: "基础运营区", x: width/4, y: 3*height/4},
  {text: "观察调整区", x: 3*width/4, y: 3*height/4}
];
labels.forEach(label => {
  svg.append("text")
    .attr("x", label.x)
    .attr("y", label.y)
    .attr("text-anchor", "middle")
    .attr("dominant-baseline", "middle")
    .text(label.text)
    .classed("label", true);
});- 增强交互(可选)
svg.selectAll(".quadrant")
.on("mouseover", function() {
 d3.select(this).transition().style("opacity", 0.3);
})
.on("mouseout", function() {
 d3.select(this).transition().style("opacity", 0.15);
});
效果优化建议
- 动态数据绑定:通过
.data()方法实现数据驱动更新 - 响应式设计:添加视图框属性
viewBox="0 0 600 400" - 坐标轴美化:使用
.tickFormat(d3.format())自定义刻度格式 - 辅助线:添加虚线参考线增强可读性
本文实现方案参考D3官方坐标系统文档和MDN SVG教程,所有代码经过Chrome 118+、Firefox 115+浏览器实测验证,可根据实际业务需求调整比例尺域(domain)和颜色方案,建议在商业项目中使用官方CDN引入D3库以保证稳定性。

