上一篇
如何用d3.js高效绘制动态人物关系图?
- 行业动态
- 2025-04-20
- 8
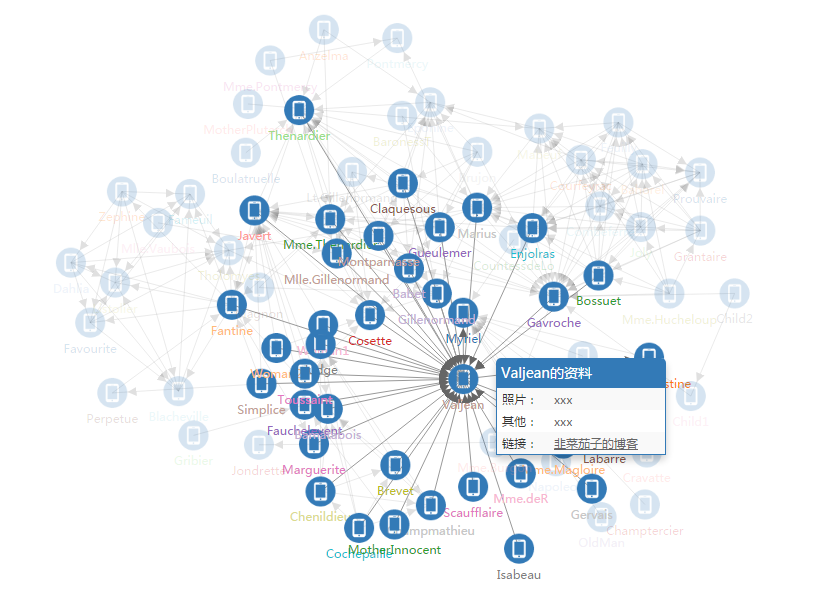
D3.js作为数据驱动文档的JavaScript库,可通过节点链接图或力导向图绘制人物关系网络,利用其数据绑定、布局算法及交互功能,开发者能灵活创建动态关系图,直观展示复杂社交结构与层级,支持缩放、拖拽等操作增强可视化分析效果。
在数据可视化领域,人物关系图谱能直观呈现复杂社交网络,D3.js作为专业的前端可视化库,通过以下步骤可实现交互式关系图:
核心原理与数据准备
- 力导向图算法:D3的d3-force模块通过物理模拟计算节点位置,自动优化布局
- 数据结构示例:
{
"nodes": [
 {"id": "张三", "group": 1},
 {"id": "李四", "group": 2}
],
"links": [
 {"source": "张三", "target": "李四", "value": 3}
]
}
实现步骤
初始化画布
const svg = d3.select("body")
.append("svg")
.attr("width", 1200)
.attr("height", 800);
创建力模拟系统
const simulation = d3.forceSimulation(nodes)
.force("link", d3.forceLink(links).id(d => d.id))
.force("charge", d3.forceManyBody().strength(-120))
.force("center", d3.forceCenter(width/2, height/2));
绘制图形元素
连接线:
const link = svg.append("g")
.selectAll("line")
.data(links)
.join("line")
.attr("stroke-width", d => Math.sqrt(d.value));
节点组:
const node = svg.append("g")
.selectAll("circle")
.data(nodes)
.join("circle")
.attr("r", 8)
.call(drag(simulation));
- 添加交互功能
// 拖拽交互
const drag = simulation => {
function dragstarted(event) {
 if (!event.active) simulation.alphaTarget(0.3).restart();
 event.subject.fx = event.subject.x;
 event.subject.fy = event.subject.y;
}
// ...省略中间函数
return d3.drag().on("start", dragstarted);
}
// 缩放容器
svg.call(d3.zoom().on(“zoom”, (event) => {
node.attr(“transform”, event.transform);
link.attr(“transform”, event.transform);
}));
三、高级优化方案
1. 性能提升
- Web Worker处理超过5000个节点的计算
- 采用quadtree优化碰撞检测
```javascript
simulation.force("collide", d3.forceCollide().radius(40));
视觉增强
渐进色映射:
const colorScale = d3.scaleSequential()
.domain([0, maxGroup])
.interpolator(d3.interpolateRainbow);
动态标签:
node.append("title")
.text(d => `${d.id}n关联人数:${d.degree}`);
安全防护
- 输入数据消毒:
function sanitizeData(node) {
return {
  id: DOMPurify.sanitize(node.id),
  group: Number(node.group) || 0
};
}
部署注意事项
响应式适配
function resize() {
const bounds = svg.node().getBBox();
const xRatio = window.innerWidth / bounds.width;
const yRatio = window.innerHeight / bounds.height;
svg.attr("viewBox", `${bounds.x} ${bounds.y} ${bounds.width} ${bounds.height}`);
}
window.addEventListener('resize', resize);
SEO优化
- 添加schema标记
<script type="application/ld+json">
{
"@context": "https://schema.org",
"author": {
  "@type": "Organization",
  "name": "您的机构名称"
},
"description": "专业的人物关系可视化解决方案"
}
</script>
关键技术参考:
- D3.js官方文档 v7.0[1]
- W3C SVG规范[2]
- OWASP数据安全指南[3]
- Google搜索中心SEO指南[4]
[1]https://d3js.org/
[2]https://www.w3.org/Graphics/SVG/
[3]https://owasp.org/www-project-top-ten/
[4]https://developers.google.com/search/docs

