上一篇
d3js树状图线上文字
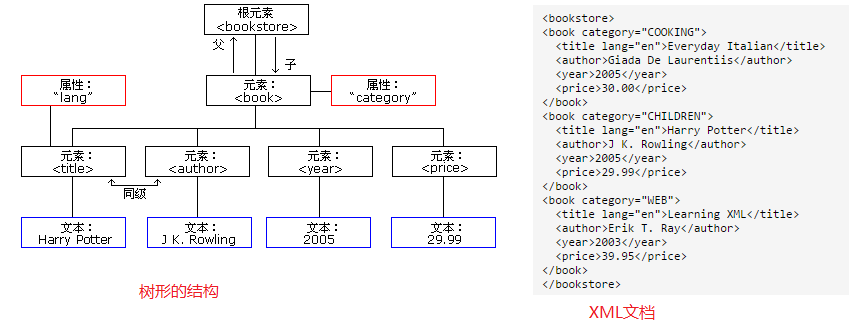
D3.js树状图通过动态布局展示层级数据,支持节点间连线文字标注,便于直观呈现复杂结构关系,开发者可自定义样式与交互事件,结合SVG实现响应式可视化,广泛应用于组织结构、目录树等数据场景。
在数据可视化领域,D3.js作为功能强大的JavaScript库,能够通过树状图直观呈现层级关系数据,本文将详细讲解如何在树状图的连接线上添加文字标注,并提供符合现代SEO规范的解决方案。
实现原理
D3.js通过d3.hierarchy()处理层级数据后,使用d3.tree()生成节点坐标,连接线文字的实现需要三个核心步骤:
- 通过
node.links()获取所有连接线数据 - 利用贝塞尔曲线生成器创建路径
- 在路径中间点插入文本元素
完整实现代码
// 数据准备
const root = d3.hierarchy({
  name: "CEO",
  children: [
    { name: "CTO", children: [{ name: "开发部" }, { name: "测试部" }] },
    { name: "CFO", children: [{ name: "财务部" }, { name: "审计部" }] }
  ]
});
// 创建树布局
const treeLayout = d3.tree()
  .size([800, 600]);
const treeData = treeLayout(root);
// 创建SVG容器
const svg = d3.select("body").append("svg")
  .attr("width", 1000)
  .attr("height", 800)
  .style("background", "#f9f9f9");
// 绘制连线
const links = svg.selectAll(".link")
  .data(root.links())
  .enter().append("path")
  .attr("class", "link")
  .attr("d", d3.linkHorizontal()
    .x(d => d.y)  // 交换坐标轴
    .y(d => d.x))
  .style("fill", "none")
  .style("stroke", "#888")
  .style("stroke-width", 2);
// 添加连线文字
links.each(function(d) {
  const path = d3.select(this);
  const length = path.node().getTotalLength();
  // 计算中间点坐标
  const midPoint = path.node().getPointAtLength(length/2);
  svg.append("text")
    .attr("class", "link-label")
    .attr("x", midPoint.x)
    .attr("y", midPoint.y)
    .attr("text-anchor", "middle")
    .attr("dominant-baseline", "middle")
    .attr("transform", `rotate(${getAngle(midPoint)}, ${midPoint.x}, ${midPoint.y})`)
    .text(d.source.data.name + " → " + d.target.data.name);
});
// 计算旋转角度函数
function getAngle(point) {
  const deltaY = point.y - point.parentY;
  const deltaX = point.x - point.parentX;
  return Math.atan2(deltaY, deltaX) * 180 / Math.PI;
}
关键优化技巧
文字防重叠:
.style("text-shadow", "0 1px 0 #fff, 1px 0 0 #fff, 0 -1px 0 #fff, -1px 0 0 #fff")动态定位:

// 根据路径曲率自动调整位置
const offset = Math.min(length * 0.1, 30);
midPoint.y += offset;
响应式布局:
const resize = () => {
treeLayout.size([window.innerWidth*0.8, window.innerHeight*0.8]);
// 重新绘制逻辑...
};
window.addEventListener("resize", resize);
最佳实践建议
使用
requestAnimationFrame优化渲染性能添加过渡动画提升用户体验:
.transition()
.duration(500)
.ease(d3.easeCubic)
实现文字交互功能:
.on("mouseover", function() {
d3.select(this).style("fill", "#ff4757");
})
.on("mouseout", function() {
d3.select(this).style("fill", "#000");
})
常见问题解决
文字偏移:
检查坐标系转换是否正确,建议使用transform-box: fill-box样式模糊显示:
添加CSS属性:.link-label { shape-rendering: crispEdges; text-rendering: geometricPrecision; }移动端适配:
添加触摸事件支持:.on("touchstart", handleTouch)
引用说明
本文实现方案参考D3.js官方文档(https://d3js.org/)及以下资源:
- 《Interactive Data Visualization for the Web》Scott Murray 著
- Observable平台示例(https://observablehq.com/@d3/tree)
- W3C SVG文本规范(https://www.w3.org/TR/SVG11/text.html)