上一篇
HTML5 Canvas绘制柱形图的关键步骤有哪些疑问?
HTML5中的Canvas元素是一个非常强大的工具,可以用来绘制各种图形,包括柱形图,下面我将详细介绍如何使用Canvas绘制柱形图。
准备数据
在绘制柱形图之前,首先需要准备数据,这些数据通常包括柱形图的宽度、高度、颜色以及它们所代表的值。

设置Canvas
需要设置Canvas的大小和背景色。
var canvas = document.getElementById('myCanvas'); var ctx = canvas.getContext('2d'); canvas.width = 600; canvas.height = 400; ctx.fillStyle = 'white'; ctx.fillRect(0, 0, canvas.width, canvas.height);
计算柱形图的宽度和高度
为了确保柱形图能够正确显示,需要计算每个柱形的宽度和高度,柱形的宽度会根据Canvas的宽度来计算,而高度则根据柱形的值来计算。
var barWidth = canvas.width / data.length; var maxValue = Math.max.apply(null, data.map(function(item) { return item.value; })); var barHeight = canvas.height / maxValue;
绘制柱形图
可以使用循环来遍历数据,并绘制每个柱形。
data.forEach(function(item, index) { var x = index * barWidth; var y = canvas.height item.value * barHeight; ctx.fillStyle = item.color; ctx.fillRect(x, y, barWidth, item.value * barHeight); });
添加坐标轴
为了使柱形图更加清晰易懂,可以添加坐标轴。
ctx.strokeStyle = 'black'; ctx.lineWidth = 2; ctx.beginPath(); ctx.moveTo(0, 0); ctx.lineTo(canvas.width, 0); ctx.moveTo(canvas.width, 0); ctx.lineTo(canvas.width, canvas.height); ctx.stroke();
添加标签
可以在Canvas上添加标签,以显示每个柱形的值。
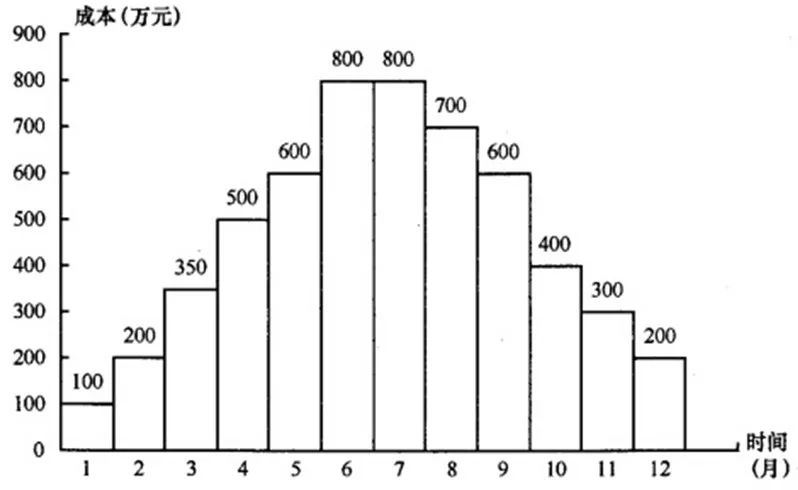
data.forEach(function(item, index) { var x = index * barWidth; var y = canvas.height item.value * barHeight; ctx.fillStyle = 'black'; ctx.fillText(item.value, x + barWidth / 2, y 5); });
FAQs
Q1:如何调整柱形图的颜色?
A1:在绘制柱形图时,可以通过修改ctx.fillStyle的值来调整柱形图的颜色,可以将ctx.fillStyle = 'red';替换为ctx.fillStyle = 'blue';来将柱形图的颜色改为蓝色。
Q2:如何调整柱形图的宽度?
A2:柱形图的宽度可以通过修改barWidth变量的值来调整,可以将barWidth = canvas.width / data.length;替换为barWidth = canvas.width / data.length * 2;来将柱形图的宽度加倍。