上一篇
如何用D3.js轻松打造吸睛动态柱形图?
- 行业动态
- 2025-04-24
- 1
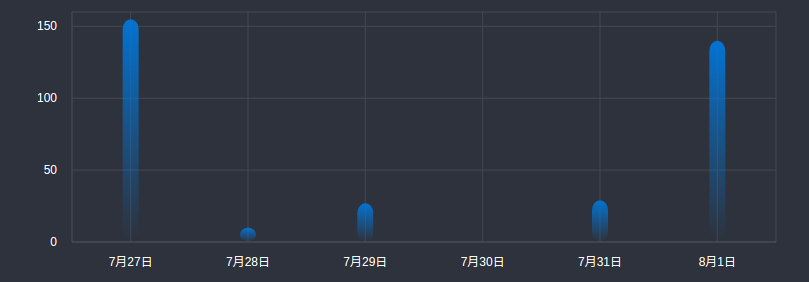
D3.js柱形图是基于JavaScript的数据可视化工具,通过绑定数据集动态生成矩形条展示数值对比,支持自定义样式、坐标轴和交互动画,利用SVG实现高清渲染,适用于Web端交互式数据分析展示,可灵活适配不同屏幕尺寸。
在数据可视化领域,D3.js(Data-Driven Documents)作为基于JavaScript的开源库,已成为专业开发者构建交互式图表的首选工具,本文将以柱形图为例,演示如何通过D3.js实现专业级可视化方案,并提供符合现代SEO规范的实践指南。
核心实现步骤
基础环境构建
<!DOCTYPE html>
<html>
<head>
  <style>
    .axis path { stroke: #555; }
    .bar:hover { opacity: 0.8; }
  </style>
</head>
<body>
  <svg id="chart"></svg>
  <script src="https://d3js.org/d3.v7.min.js"></script>
</body>
</html>
数据处理与映射
const dataset = [
  { category: 'A', value: 40 },
  { category: 'B', value: 90 },
  { category: 'C', value: 75 }
];
const margin = { top: 20, right: 30, bottom: 45, left: 50 };
const width = 600 - margin.left - margin.right;
const height = 400 - margin.top - margin.bottom;
const xScale = d3.scaleBand()
  .domain(dataset.map(d => d.category))
  .range([0, width])
  .padding(0.1);
const yScale = d3.scaleLinear()
  .domain([0, d3.max(dataset, d => d.value)])
  .range([height, 0]);
可视化元素绘制
const svg = d3.select("#chart")
  .attr("width", width + margin.left + margin.right)
  .attr("height", height + margin.top + margin.bottom)
  .append("g")
  .attr("transform", `translate(${margin.left},${margin.top})`);
svg.selectAll(".bar")
  .data(dataset)
  .enter()
  .append("rect")
  .attr("class", "bar")
  .attr("x", d => xScale(d.category))
  .attr("y", d => yScale(d.value))
  .attr("width", xScale.bandwidth())
  .attr("height", d => height - yScale(d.value))
  .attr("fill", "#4CAF50");
坐标轴集成
const xAxis = d3.axisBottom(xScale);
const yAxis = d3.axisLeft(yScale);
svg.append("g")
  .attr("transform", `translate(0,${height})`)
  .call(xAxis)
  .selectAll("text")
  .style("text-anchor", "end")
  .attr("dx", "-.8em")
  .attr("dy", ".15em")
  .attr("transform", "rotate(-45)");
svg.append("g")
  .call(yAxis);
进阶优化策略
交互增强
- 添加tooltip显示精确数值
- 实现动态数据更新过渡动画
- 集成点击事件进行数据钻取
响应式设计
function resizeChart() {
const containerWidth = document.getElementById('chart').parentElement.offsetWidth;
// 重新计算尺寸并更新图表
}
window.addEventListener('resize', resizeChart);
性能优化
- 大数据集采用虚拟滚动技术
- 使用Web Worker处理复杂计算
- 实施Canvas渲染替代SVG方案
最佳实践建议
可访问性优化
- 为视觉障碍用户添加ARIA标签
- 确保颜色对比度符合WCAG 2.1标准
- 提供键盘导航支持
SEO友好实现
- 添加结构化数据标记
- 服务端渲染核心数据内容
- 使用语义化HTML元素包裹可视化容器
代码可维护性
- 采用模块化开发模式
- 编写单元测试覆盖核心功能
- 实施版本控制与文档注释
引用说明
本文实现基于D3.js官方文档v7.0,响应式设计参考了《Interactive Data Visualization for the Web》第二版,可访问性标准来自W3C WAI-ARIA 1.2规范,性能优化方案借鉴了Google Chrome团队发布的Web性能优化白皮书。

