上一篇
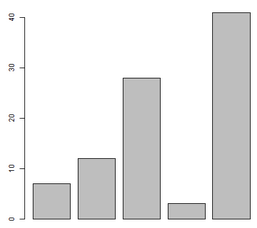
html如何做柱状图条形图
- 前端开发
- 2025-07-09
- 4992
HTML5的Canvas元素结合JavaScript绘制,或借助ECharts、Highcharts等图表库实现
HTML中制作柱状图和条形图,可以通过多种方法实现,以下是几种常见的方式及其详细步骤:
使用HTML5 Canvas绘制
基本步骤
- 创建Canvas元素:在HTML中添加一个
<canvas>标签,设置其宽度和高度属性,这将作为绘图的画布。 - 获取Canvas上下文:使用JavaScript获取Canvas的2D绘图上下文,通过
getContext("2d")方法。 - 准备数据:定义要展示的数据,可以是静态数组或从服务器获取的动态数据。
- 绘制图形:根据数据计算每个柱子的高度(对于柱状图)或宽度(对于条形图),然后使用Canvas的绘图方法如
fillRect或strokeRect来绘制矩形。 - 添加样式和标签:设置颜色、边框等样式,并添加坐标轴标签、标题等文本信息。
示例代码(柱状图)
<!DOCTYPE html>
<html lang="en">
<head>
    <meta charset="UTF-8">Canvas 柱状图</title>
    <style>
        canvas {
            border: 1px solid #000;
        }
    </style>
</head>
<body>
    <canvas id="myChart" width="600" height="400"></canvas>
    <script>
        const canvas = document.getElementById('myChart');
        const ctx = canvas.getContext('2d');
        const data = [10, 20, 30, 40, 50];
        const labels = ['A', 'B', 'C', 'D', 'E'];
        const maxValue = Math.max(...data);
        const barWidth = 50;
        const gap = 20;
        const xScale = (canvas.width (barWidth + gap)  (data.length 1)) / maxValue;
        const yScale = (canvas.height 40) / maxValue;
        // 绘制坐标轴
        ctx.beginPath();
        ctx.moveTo(40, 360);
        ctx.lineTo(40, 40);
        ctx.lineTo(canvas.width 20, 40);
        ctx.stroke();
        // 绘制柱状图
        for (let i = 0; i < data.length; i++) {
            const x = 40 + i  (barWidth + gap);
            const y = 360 data[i]  yScale;
            ctx.fillStyle = 'blue';
            ctx.fillRect(x, y, barWidth, data[i]  yScale);
            ctx.fillStyle = 'black';
            ctx.fillText(labels[i], x + 10, 370);
            ctx.fillText(data[i], x + 15, y 5);
        }
    </script>
</body>
</html>
使用SVG绘制
基本步骤
- 创建SVG元素:在HTML中添加
<svg>标签,设置其宽度和高度属性。 - 定义数据和比例:与Canvas类似,定义数据并计算每个柱子的高度或宽度以及位置。
- 绘制矩形:使用
<rect>元素表示柱子,通过设置其x,y,width,height属性来定位和调整大小。 - 添加样式和标签:使用CSS或直接在SVG元素上设置样式属性,如
fill(填充色)、stroke(边框色)等,并添加文本标签。
示例代码(条形图)
<!DOCTYPE html>
<html lang="en">
<head>
    <meta charset="UTF-8">SVG 条形图</title>
    <style>
        svg {
            border: 1px solid #000;
        }
    </style>
</head>
<body>
    <svg id="barChart" width="600" height="400"></svg>
    <script>
        const svg = document.getElementById('barChart');
        const data = [10, 20, 30, 40, 50];
        const labels = ['A', 'B', 'C', 'D', 'E'];
        const maxValue = Math.max(...data);
        const barHeight = 30;
        const gap = 10;
        const yScale = (svg.clientHeight (barHeight + gap)  (data.length 1)) / maxValue;
        // 绘制条形图
        data.forEach((value, index) => {
            const x = svg.clientWidth 30 value  yScale;
            const y = 20 + index  (barHeight + gap);
            const rect = document.createElementNS('http://www.w3.org/2000/svg', 'rect');
            rect.setAttribute('x', x);
            rect.setAttribute('y', y);
            rect.setAttribute('width', value  yScale);
            rect.setAttribute('height', barHeight);
            rect.setAttribute('fill', 'blue');
            svg.appendChild(rect);
            // 添加标签
            const text = document.createElementNS('http://www.w3.org/2000/svg', 'text');
            text.setAttribute('x', x);
            text.setAttribute('y', y + barHeight / 2);
            text.setAttribute('dy', '0.35em');
            text.setAttribute('text-anchor', 'start');
            text.setAttribute('fill', 'black');
            text.textContent = labels[index];
            svg.appendChild(text);
            const valueText = document.createElementNS('http://www.w3.org/2000/svg', 'text');
            valueText.setAttribute('x', x + value  yScale + 5);
            valueText.setAttribute('y', y + barHeight / 2);
            valueText.setAttribute('dy', '0.35em');
            valueText.setAttribute('text-anchor', 'start');
            valueText.setAttribute('fill', 'black');
            valueText.textContent = value;
            svg.appendChild(valueText);
        });
    </script>
</body>
</html>
使用第三方库(如Chart.js)
引入库文件
首先需要在HTML中引入Chart.js库,可以通过CDN链接或下载到本地后引入,使用CDN链接的方式如下:
<script src="https://cdn.jsdelivr.net/npm/chart.js"></script>
创建Canvas元素并初始化图表
在HTML中创建一个<canvas>元素作为图表的容器,然后在JavaScript中使用Chart.js提供的API来初始化图表并传入数据,创建一个柱状图的代码如下:
<!DOCTYPE html>
<html lang="en">
<head>
    <meta charset="UTF-8">Chart.js 柱状图</title>
    <script src="https://cdn.jsdelivr.net/npm/chart.js"></script>
</head>
<body>
    <canvas id="myChart" width="600" height="400"></canvas>
    <script>
        const ctx = document.getElementById('myChart').getContext('2d');
        const myChart = new Chart(ctx, {
            type: 'bar', // 指定图表类型为柱状图
            data: {
                labels: ['A', 'B', 'C', 'D', 'E'], // X轴标签
                datasets: [{
                    label: '数据集1', // 数据集名称
                    data: [10, 20, 30, 40, 50], // 数据值
                    backgroundColor: 'rgba(54, 162, 235, 0.2)', // 柱子的填充颜色
                    borderColor: 'rgba(54, 162, 235, 1)', // 柱子的边框颜色
                    borderWidth: 1 // 柱子的边框宽度
                }]
            },
            options: {
                scales: {
                    y: {
                        beginAtZero: true // Y轴从0开始
                    }
                }
            }
        });
    </script>
</body>
</html>


